In our last update from early May, we found for the Nasdaq 100 using primarily the Elliott Wave Principle (EWP): “ The current rally off the recent low counts best as a counter-trend rally [ to ideally $17900-18250 ] and, together with seasonality, suggests the next leg lower to ideally $15900+/-500, is underway, contingent on holding below the warning levels for the Bears outlined in this article .” Well, as they say, ” 60% of the time, it works all the time ” [Anchor Man], and the market stopped following the average seasonal path. Moreover, the index is now trading at around $18710.
So, let's review how we have forecasted the NDX over the past month to understand better how the EWP works, how our forecasting works, and how to apply it. In April, we had three (grey a-b-c) waves from the red W-a low into the green W-a high (see the chart below). Since the red W-a counted best as three waves lower, we knew that " after three waves down, expect at least three waves back up " because either the correction became protracted/complex (triangle or flat) or it ended with those three waves lower (zigzag).

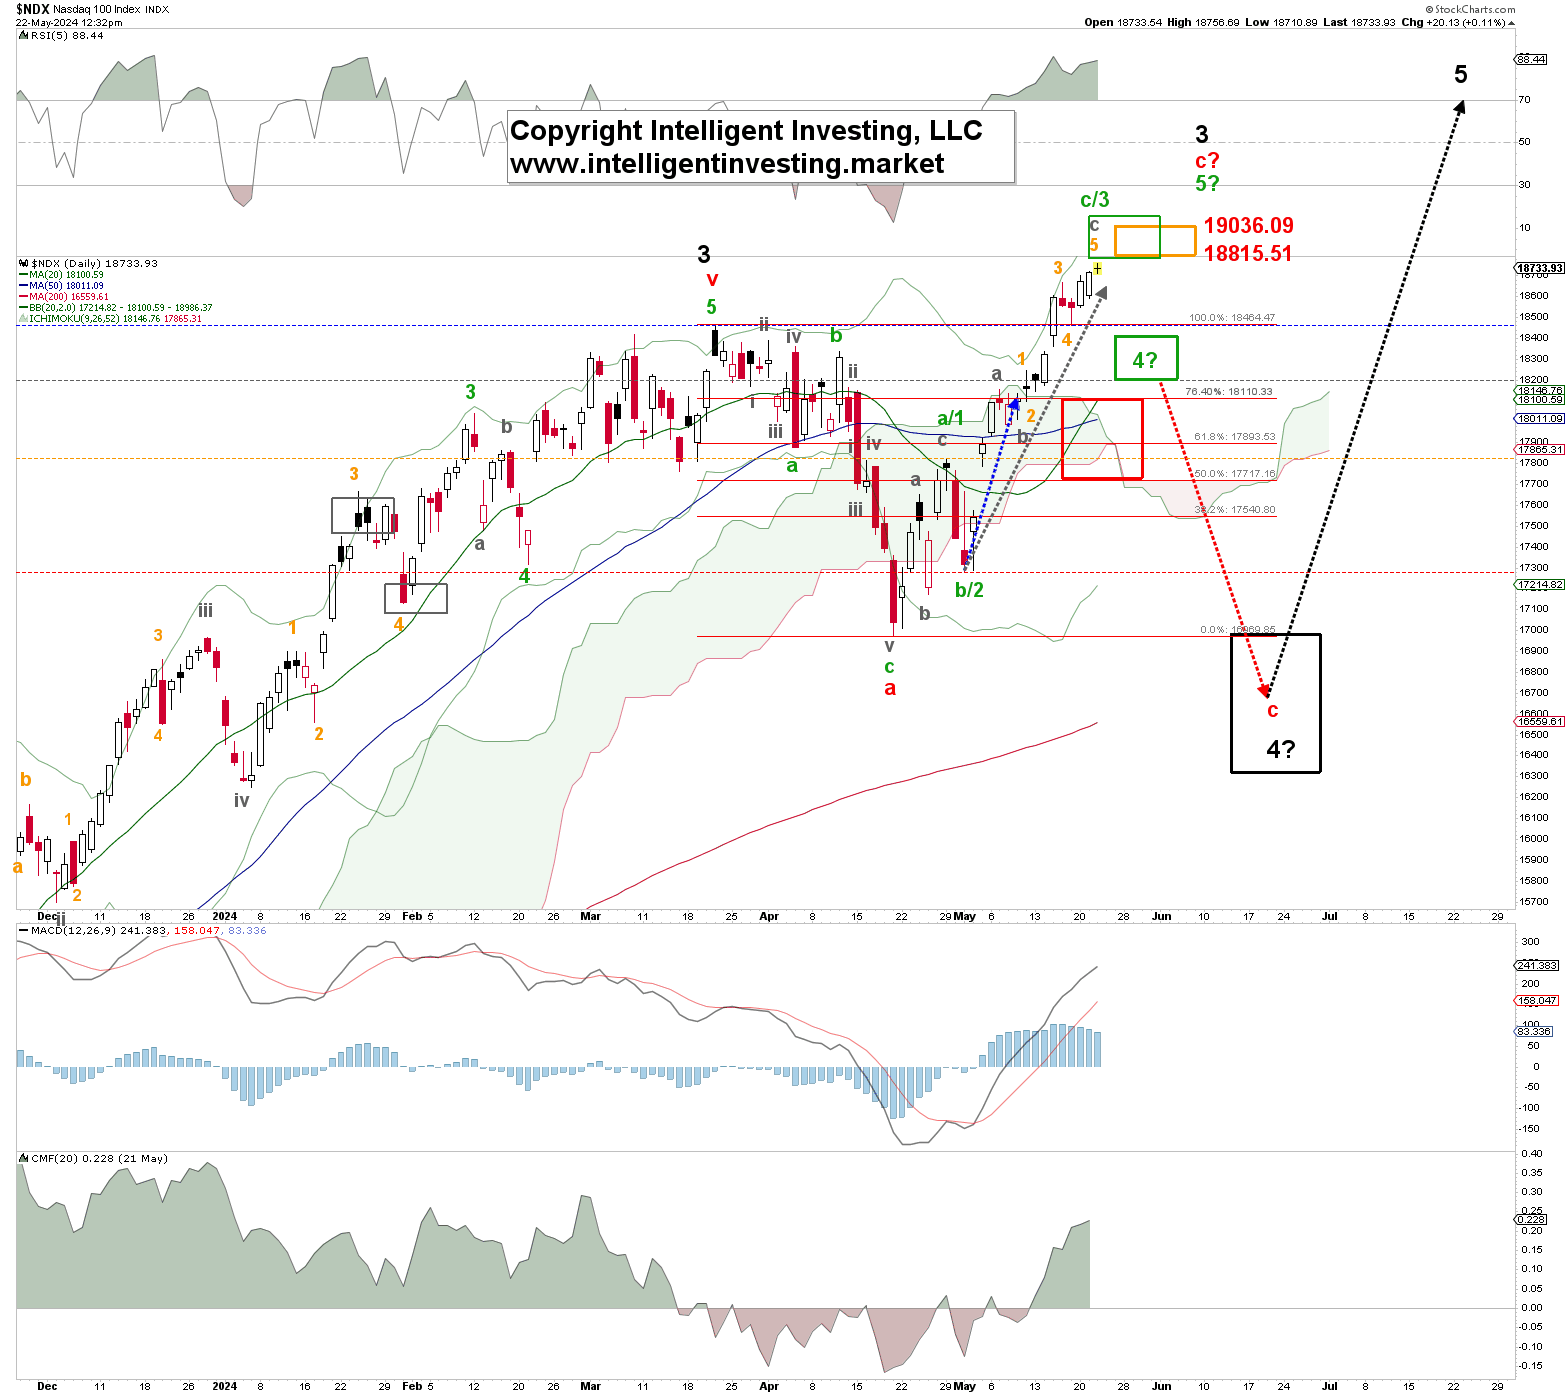
We cannot know beforehand which it will be. Figure 1. NDX daily chart with detailed EWP count and technical indicators However, with those initial three grey waves up into the April 29, green W-a, high, at around the 50-62% retracement (See red target box), the " at least three waves back up " leg appeared most likely completed.
Moreover, we got five waves lower just before .